Google Analytics API Guide for Absolute Beginners — Chapter Two
Welcome back to the second chapter of our “Google Analytics API Guide for Absolute Beginners”.
In our last post, we discussed the basics about APIs and why they are important for analytics: Google Analytics APIs for Absolute Beginners
We also presented the two primary APIs related to Google Analytics but stopped short of explaining our main topic today — the Google Analytics Reporting API.
Today, we will cover pretty much everything else(that we can think of) that you’ll need to know about the Google Analytics Reporting API, which includes, but is not limited to:
What exactly does this API do?
How does the reporting API compare to the Google Analytics user interface?
How to (conceptually) submit requests to this API
As hinted at multiple times in the previous paragraphs, we are only going to cover concepts here. Details about concrete action steps that you can take to use the API will be covered in detail in later posts.
Let’s start!
What exactly does this API do?
Note: This section can get a little dry, so there’s a TL;DR at the end in case you get bored. But I STRONGLY recommend that you read this section, as it contains a really important background about data analytics in Google Analytics.
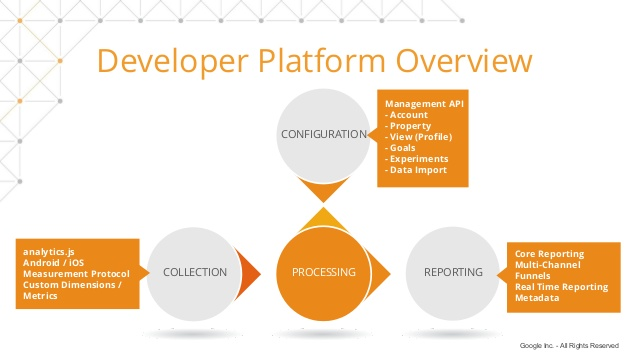
To understand how exactly the Google Analytics Reporting API fits into the entire Google Analytics lifecycle, let’s first start with an overview of how Google Analytics gets and manipulates data from your website (and potentially other sources).
google-analytics-apis-for-absolute-beginners
Google Analytics API Guide for Absolute Beginners — Chapter Two
First, Google Analytics collects data about your web presence from various sources.
There are three primary sources of this data:
User activities on your website or app
Any CRM and external data sources you provided to Google Analytics
The demographic information collected by Google about users visiting your website
Then, based on the configurations of your Google Analytics account (either through the Management API or User Interface), Google Analytics processes the data and convert those data into a format that is ready for analysis.
Okay, let’s stop here and take a breather. The next part is really important, but also could be fairly confusing.
Google does not actually turn the data into tabular form that you see during your weekly or monthly report during the processing and cleaning steps.

This is a table. Google makes data into this, but there’s a whole lot of Google that happens first
This is a table. Google makes data into this, but there’s a whole lot of Google that happens first

It’s a lot of numbers…
Instead, it will still look rather raw and more like the snapshot presented below (this is actual “cleaned” clickstream data):
It’s a lot of numbers…
In reality — the “processed” Google Analytics data is even longer!
Why? Google Analytics may do things like breaking URLs into multiple columns during the cleaning process. So, then why does it all stay in this “long and confusing” format?
A tabular format can only accommodate 1–2 metrics (like number of sessions, or pageviews) and most, 2 dimensions (like age and gender).
That said, each row of Google Analytics “hit” data may contain hundreds of dimensions and metrics by itself, making it literally impossible to present the data in a table
Furthermore, Google Analytics accommodates needs at different levels of analysis, that is, at a hit level (for pageview and events), at a session level (multiple hits), or at a user level (multiple sessions).
As the “level of analysis” increases in generality (from “hit” to “sessions” for example), some information at the lower level is lost forever as result of data merging, meaning that data no longer available for analysis
This means that unless Google Analytics wants to represent the exact same data multiple times at different levels, it is a standard practice to keep all data at the lowest level (“hit”), and merge/combine the data on the fly when a higher level of analysis is needed.
Despite all those complications, In data science these data are said to be “ready for analysis” because they are ready to be filtered, sliced, and diced into multiple reports based on users’ analytical needs, but as an analyst/data scientist you still need to do that yourself.
Knowing that most users will not be able to manipulate and filter the data themselves, developers at Google Analytics identified few most important analysis a user should conduct on their website, and built an user interface on top of these analyses — that’s essentially how the Google Analytics User Interface comes into being.
However, those pre-developed features are only “best guesses” developers at Google have about your needs, and businesses usually have custom analytical needs about their data, that’s why the Google Analytics Reporting API is open to enable those customizations to occur.
In addition, because many of the features on the Google Analytics user interface is actually developed using the Google Analytics Reporting API, the Reporting API also enable users to replicate parts of the Google Analytics User Interface into their own reporting platforms or applications, giving room for automations to occur.
TL;DR: Google Analytics Reporting API offer you ways to slice and dice processed Google Analytics data yourself, instead of solely relying on analyses at the Google Analytics User Interface.
Key Similarities and Differences Comparing with the Google Analytics User Interface

So how exactly is the Google Analytics API differ from the traditional user interface?
Similarities
Because the Reporting API and the user interface are based on the exact same dataset, they do not differ in any way in terms of the metrics and dimensions provided — the only differences will be in the way those data are being analyzed and presented.
Overall, the Google Analytics Reporting API and the GA user interface overlap 80–90% in terms of the data it provides to users.
This means that most features in the user interface, ranging from conversion analysis to cohort analysis, can be replicated using the Google Analytics Reporting API (the only thing is that you need to present the data yourself in the API).
Differences
While the data source of those two platforms is similar, those two platforms are very different in many aspects.
To summarize the differences in one sentence:
The reporting API is a lot better at building customized, flexible solutions for organizations with advanced analytical needs, while the user interface is for someone who wants to look through their data quickly.
Let’s illustrate this point with one example.
One of the biggest capability stemmed from the flexibility of Google Analytics reporting API is the potential for much more advanced attribution analysis.
The default Google Analytics channel grouping is very restricted in terms of what traffic it assigned to each default channels.
Sometimes, even simple utm tag mistakes such as accidentally type “Facebook” instead of “facebook” will result in misattribution of social media sources into referral traffic.
Based on our experiences working with hundreds of companies at this point, we can pretty confidently say that over 50% of the companies that we talked to are either not using or misusing the attribution feature of Google Analytics due to attribution errors.
While you are able to add some customization to your channel grouping using the custom channel grouping tool in Google Analytics, you still cannot answer some advanced attribution questions such as:
What if I want to group all my facebook traffic under one source, but then split out organic and ads from Facebook to analyze them separately (hierarchical traffic analysis)?
What if I want to assign traffic from the same utm tag into different sources based on the time the traffic was recorded (time-sensitive attribution analysis)?
All of these challenges presented above can be resolved using the Google Analytics API (more on this in later posts).
In addition to merely flexibility differences, there are few features that are available in the reporting API but not in the user interface, and vice versa.
What is unique to Google Analytics User Interface?
The biggest feature that is unique to the user interface is the behavior flow report.
This is probably a bummer for a lot of you out there since the behavior flow report is perhaps one of the most useful reports in Google Analytics.
However, due to the complexity of actually coming up with the behavior flow report (you have to group data by sessions and examine users’ journey in time across different pages), the Google Analytics Reporting API does not offer an intrinsic way of replicating this report quickly.
But let’s not give up so fast, as I am writing this and thinking about dimensions and metrics in Google Analytics Reporting API, I have a few theories in mind that may allow me to replicate this report using the Analytics API, I will document my processes and findings and get back to y’all in a later post.
What is unique to Google Analytics Reporting API?
I am going to focus on two primary features here: multidimensional analysis and dynamic segmentation.
Let’s start with multidimensional analysis.
As I mentioned previously, the human eye is really bad at processing anything beyond a traditional tabular format, which is 2 dimensions.
This means that while analyzing your number of sessions (1 metric) across ages, gender, geographic location, and source (here are 4 dimensions) might yield great insights for your business, you simply cannot analyze it without the help of mathematical tools such as linear algebra.
However, the user interface of Google Analytics does not offer any support for analysis beyond 3 dimensions. This means that you will have to get the data from the reporting API and use your own matrix-friendly libraries such as numpy and pandas to conduct your analysis.
The second feature unique to the reporting API is dynamic segmentation.
In Google Analytics, creating customer segments are very manual — you have to name the segment, set criteria before using it for analysis.
Furthermore, there is a limit to how many segments you can create (100), and as segment number goes up, it becomes difficult to choose one of them for your analysis.
Enter the dynamic segment feature of the reporting API.
What it allows you to do is to create segments on the fly based on the need of that specific analysis.
This is significant because it allows you to adjust segments dynamically based on the result of your previous analysis to make your that your segment is the most accurate one that separate behaviors of different customers in your data — an incredibly powerful utility.
What neither of them can do
While the Google Analytics reporting API grants you much more direct access to the raw clickstream data of your website, the reporting API does not intrinsically offer a way for you to get all of your “hit” by “hit” data downloaded on your computer (only apply for the free version of Google Analytics).
It is technically possible to bypass this restriction by submitting a large amount of API requests in a few days’ period, my principle here is that I would not recommend you doing so anyway since those data by itself will NOT provide you with a lot more insights than what Google Analytics currently offers.
How to (conceptually) submit requests to this API

Okay, after talking about what the Google Analytics API does, it is now time to talk about how to use it.
Conceptually, using the Google Analytics Reporting API requires four primary steps: 1) constructing the request, 2) building an authentication engine, and 3) submitting the request and parsing the report, 4) presenting/piping the data
1) Constructing the request
Constructing the Google Analytics Reporting API request can be divided further into two baby steps: figuring out what analysis ahere to your business needs, and convert that analysis specification into the request format of Google Analytics Reporting API.
The first part of this step, “figuring out what analysis ahere to your business needs”, is probably one of the most important parts of the entire process.
The rationale is simple — if you don’t keep business value at the forefront of your analytical steps, you will only at numbers and insights at the end, instead of business values that can help you increase revenue.
We will show you a few rules of thumbs to help you do this in the next post, meanwhile, let’s talk about converting request specifications into the format of Google Analytics reporting API.
While this step may sound easy, it is, in fact, the most technical aspect of the entire process.
This is because you need to 1) understand the structure of the API request very well, 2) understand how to convert the business specifications into those structures, and finally, 3) write and comment on reusable and object-oriented code to make future analysis and quality assurance much easier.
I am not going to lie that just writing those steps out sometimes give me a headache, but worry not, I am here to walk you through all the steps and keep the pain at a minimum.
After constructing the request, time to move onto actually submitting the request.
2) Building an authentication engine
The first step in submitting the request is building an authentication engine.
Think of the authentication engine as a way of you logging into Google Analytics programmatically.
Here, we will go through the basic principles of Oauth 2.0 and why is it important to keep your data safe at Google, and then show you a few pre-built libraries (via python) that can help you easily authenticate your requests.
3) Submitting and parsing the request
After authenticating your request, it is time to actually submit the request and parse it.
As explained before in this series, the Reporting API, as an REST API, communicates primarily through a file format called JSON.
For this reason, you will get your data back in the format of JSON as well, and you need to write some simple code to parse JSON into the format that we can understand.
We will show you how to use the “pandas” library in python to accomplish that.
4) Presenting or piping the data
Finally, after getting the data from Google Analytics, we need to convert the data into some format that is viewable by our key audiences, whether that’s our manager or client.
There are primarily two ways of doing it: 1) exporting the Google Analytics data into excel or tableau and convert those data into various graphs and dashboards, or 2) piping the data programmatically into some web application platforms and presenting them dynamically as the data changes.
We will cover both ways of doing this, along with few principles you need to keep in mind when presenting the data when we get to this step.
I personally find this step extremely fulfilling and enjoyable after all these work in the previous steps, I am pretty sure you will love it too!
Wow, we are already at over 2000 words, it is time to pause and take a break.
Next week, we will start by reviewing the specific structure of the reporting API request, along with a few pointers on how to best make a request that is truly useful for your business.
Until next time!
This article was produced by Humanlytics. Looking for more content just like this? Check us out on Twitter and Medium, and join our Analytics for Humans Facebook community to discuss more ideas and topics like this!