How to identify and fix the problem pages on your website with Google Analytics
This article drills down into the 3rd business question that Google Analytics can help you answer (Pages: How are each pages on my website performing?) from our series on the 4 Business Questions Google Analytics Can Answer About Your Website Visitors
Recently, I engaged in a consulting project with a restaurant chain in which I helped them establish their baseline metrics for web analytics.
As I went through their website data, one thing that struck me was how many visitors were exiting from their menu page. In other words, the bounce rate for this page was noticeably higher than that of other pages.
Upon further investigation, I discovered that the layout of the menu page strikingly resembled that of the home page. In fact, at first, I didn’t even know I was on the menu page. I also realized that the loading time for that specific page was a whopping 8 seconds.That was almost 4 times the average load time of the other pages.
Pages like this can do real damage to your user’s experience. Compounding this problem is the fact that the menu page is of crucial importance restaurant chain’s website.
This article provides a step-by-step guide to help you identify sub-optimal pages and then offers suggestions on how can you optimize them scientifically. More specifically, here is what you will learn:
What Google Analytics can tell you about the performance of each web page.
How to identify major “problem pages” and which one to optimize first.
How to optimize the “problem pages” once they’ve been identified.
It’s worth mentioning that this is a great time to discuss website optimization since Google just released their Google Optimizetool.Also,it’sfree.
In fact, this post can help you better take advantage of Google Optimize by addressing the quintessential question of optimization: What should you optimize first?
Let’s begin!
What Google Analytics can tell you about the performance of each web page.
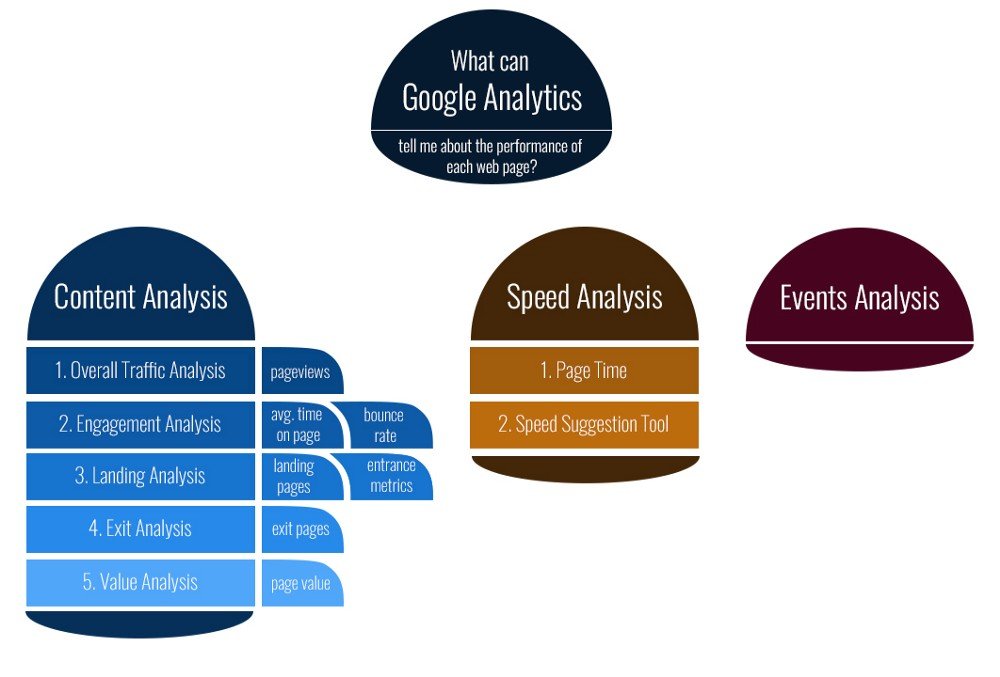
Google Analytics provides you with the following analytics features when analyzing the performance of each web page:
Content Analysis: How users are engaging with each of the pages.
Speed Analysis: How fast each of your pages is loading?
Event Analysis (requires setup): How frequently events (such as button clicks) are carried out on your website.
Content Analysis
Content analysis is probably the most important module to consider in order to understand the performance of each of your pages. It can be found under the Behavior -> Site Content section of Google Analytics.

Although there are many ways to group your pages for analysis (by page title, for example), I usually recommend sticking with the default option (pages) to ensure that your data is most accurately represented.
More specifically, there are five kinds of content analysis that you can conduct.
Overall Traffic Analysis: This shows which pages are the most and least frequently visited. This analysis uses the “pageviews” and “unique pageviews” metrics under the “Site Content” -> “All Pages” section (see figure 2).
Engagement Analysis: This shows which pages have the highest and lowest user engagement metrics. This analysis uses the “avg. time on page” and “bounce rate” metrics under the “Site Content” -> “All Pages” section (see figure 2).
Landing Analysis: The pages which users most often the first encounter when they enter your website. This analysis uses the “Site Content” -> “Landing Pages” section, along with the “entrance” metric under the “Site Content” -> “All Pages” section (see figure 1 and 2).
Exit Analysis: The pages that most often serve as the last page that users see. This analysis uses the “Site Content” -> “Exit Pages” section (see figure 1).
Value Analysis (requires setup): The importance of individual pages in contributing to the ultimate conversion of visitors. In other words, this shows which pages have the highest and lowest user engagement levels. This analysis uses the “page value” metric under the “Site Content” -> “All Pages” section (see figure 1).

Figure 1

Figure 2
Speed Analysis
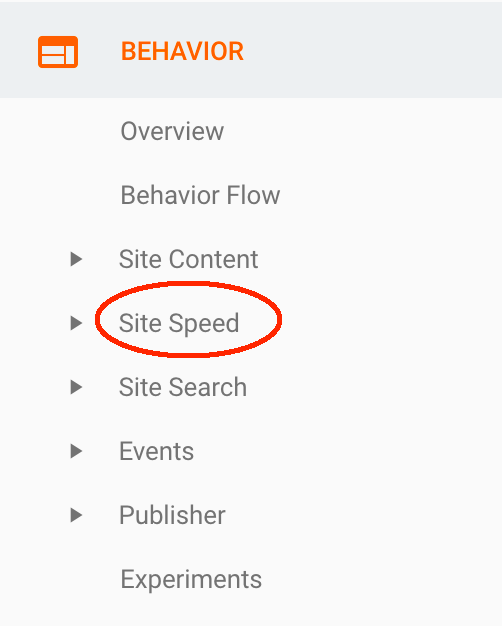
Speed analysis analyzes the loading speed of your pages by country and browser to identify pages that have significantly longer loading times. It can be found under the “Behavior” -> “Site Speed” section of Google Analytics.
As we dig further, under the “Site Speed” -> “Page Timing” section you can find a side-by-side comparison of the loading speeds (and other metrics such as total pageviews) of various pages of your website.
This tool is particularly helpful because it shows you in a clear cut way which pages are taking significantly longer to load.
Another very useful tool under the speed analysis section is the site speed optimization tool, which can be found within the “Site Speed” -> “Speed Suggestion” tool.
In the speed optimization tool, you can run a diagnosis on a specific page and receive recommendations from Google regarding how to improve the loading speed of that specific page.
Event Analysis
Event analysis can only be conducted if you have set up Google Analytics event tracking beforehand (you can learn more about event tracking here). It can be found under the “Behavior” -> “Events” section of Google Analytics.

In short, I consider event analysis a more detailed version of “overall traffic analysis”, as it goes one unit of analysis deeper into the web page data.
While “overall traffic analysis shows you how well your pages are doing in general, event analysis also shows you how your users are interacting with specific elements (such as which buttons or graphics they’re clicking) on each page.
Event analysis is critical for web page optimization, as it not only shows you which page is functioning sub-optimally, but also which specific elements on that page are distracting from your user’s’ experience.
How to identify major “problem pages” and which one to optimize first.

To identify the sub-optimal pages, you need to look at two factors: Page Importance and Page Performance.
A page is said to be important if it satisfies the following criteria, each of which is associated with a specific analysis:
High Overall Traffic (Overall Traffic Analysis): If the traffic (defined by both pageviews and unique pageviews) makes up a large proportion of the overall traffic of the website.
High Number of Entrances (Landing Analysis): If customers land on this specific page significantly more often than other pages (higher % landing compare with other pages).
High Page Value (Value Analysis): If this page is of high value (as defined by the “page value” metric) in a customer’s conversion journey.
High Event Frequency (Event Analysis): If a specific page contains a large portion of the event clicks carried out on the site.
The more of the above criteria that a page satisfies, the more important that page is to your website. However, beyond “important pages” it’s also essential to make sure that you boost the performance of suboptimal pages. That’s why we use separate indicator: to identify the important pages that are performing sub-optimally so that we can fix them.
A page is said to have poor performance if it satisfies one or more of the following criteria:
Low Engagement Metrics (Engagement Analysis): Users spend less time on the page and it has a me on page and high bounce rate.
High Exit % (Exit Analysis): The page has a high exit rate and share.
Slow Speed (Speed Analysis): The page has a loading speed that is significantly slower than other pages.
As a note, it is essential to start with importance analysis before moving on to performance analysis. This is because there may be pages that are performing sub-optimally because they are not being visited in the first place. If this is the case, you will be dealing with inaccurate data about the actual performance of the page since you don’t know how it would perform with a normal amount of traffic.
Therefore, to identify which pages to optimize first, find the pages that are (1) most important, and (2) worst performing. As athletes like to say, “Race your strengths. Train your weaknesses.”
A special note about the homepage
One page that the analytics criteria doesn’t apply to is the home page.
The home page is unique in the sense that it will almost always have the highest percentage landing and exit of all pages on your website. This is because it serves as the filter of uninterested users.
Therefore, high exit rate or bounce rate on the homepage does not always mean that its performance is suboptimal. Rather, it might mean that you are attracting users that are simply uninterested in your offerings.
For example, I once had a client with a bounce rate of over 90% on their home page. However, after analysis, I realized that the cause of their high bounce rate was not necessarily due to a bad experience on the homepage. More likely, it was because they ran a really broad Google Adwords campaign and thus drew a lot of uninterested users onto their website.
To tell whether the high bounce rate of the homepage is caused by incorrect targeting or a sub-optimal page experience, you need to connect with advertising platforms such as Google Adwords and Facebook Advertising. This will allow you to check whether you have a good engagement rate by allowing you to see metrics such as “Click Through Rate”.
If your engagement rate is great on your advertising platforms then the problem isn’t your advertising channels but rather the user experience of your web pages. If this is the case, your home page needs to be optimized to either provide a more trustworthy experience or more tailored to fit the audience you are targeting.
How do you optimize your sub-optimal pages after you identify them?
After you have identified your sub-optimal page, it is time to optimize it.
If you have set up event tracking, it is time to go back to the event analysis page and examine the performance of events on that specific page.
If you do not have event tracking, go to that page and make a few hypothesis of why that page is performing sub-optimally.
Elements that might cause a site to operate at a sub-optimal level may vary greatly. Here are three of the most common problems.:
Untrustworthy Layout: If you designed the website yourself using an out-of-the-box tool like Shopify or Squarespace, more likely than not, the layout of some of your pages will feel unnatural. These unnatural layouts will make your websites feel less trustworthy and thus lead to a low conversion rate. If you are having this problem, hire a freelance designer to customize the theming and layout of your pages.
Lack of Call-to-Action Elements: Call to action elements are elements of your website that encourage users to take the next step in engaging with your website, whether that’s signing up for a newsletter or making a purchase. Many studies have shown that adding a call-to-action button can drastically improve your conversion rate. If you don’t have them, add them, and do it now.
Long Load Time: It’s true that web visitors have an attention span that is shorter than that of a goldfish.So, if your pages take too long to load, your visitors will likely leave the site. In fact, a longer load time is directly correlated with a lower conversion rate. If you have a page that takes too long to load, use the Google Pagespeed Insight tool to fix it!
Either way, come up with a few alternatives to the design you currently have and conduct several A/B testing experiments with Google Optimize. Keep testing and iterating until your user experience improves.
Keep in mind that, although you feel an urge to conduct multiple A/B tests at the same time on the same page, it is recommended that you only do one test at a time in order to guarantee the integrity of your experiment.
For more tutorials on how to use Google Optimize, please reference their website here.
Conclusion
This article showed you how to use Google Analytics to conduct various page analyses in order to identify pages that are operating on a sub-optimal level.
As a concluding remark, it is important to understand that optimization should be a continuous effort and not a one-time task.
There will always be sub-optimal pages for you to optimize. That’s why companies like Amazon spend millions of dollars every year: to ensure that their website most effectively geared towards conversion.
However, optimizing your website on a page-by-page basis is not enough. Your website also may be performing suboptimally due to poorly designed user flow.
That’s why, in the next blog post of our Google Analytics fundamental series, we are going to venture ahead and examine Google Analytics functionalities of user flow analysis. This will help you get your user flow right in no time.
Thanks for reading this article. I hope it helps you further engage your users via multiple channels. If you have any questions or want to learn more about optimizing your web pages, email me at bill@humanlytics.co.
This article is part of our Google Analytics fundamentals series. In the next article, we are going to talk about how you can use Google Analytics for page-by-page optimization (the 3rd question you can answer with Google Analytics). Stay tuned!
If you are interested in more content like this, please follow us on Twitter, Facebook, and Medium (at analytics-for-humans).
This article is produced by Humanlytics. At Humanlytics, we build tools for SMBs that not only help them answer their business questions and track metrics in real time, but also tell them what questions they should be asking in the first place — all with the goal of teaching them how to implement solutions.