How to Set Up Goal Funnel Visualization Reports on Google Analytics
Find Funnel Drop Off Points to Maximize Your Conversion Rate

In last week’s article, we walked you through how to properly set up Google Analytics and Google Tag Manager. In that tutorial, we briefly explained how to set up Google Analytics goals in order to measure your business objectives for your digital channels.
However, although setting up individual Goals such as newsletter signups and product purchases are essential (after all, you can’t improve what you can’t measure), the next step we recommend to every business is to set up what Google Analytics calls “Goal Funnels.”
In marketing, goal funnels (or conversion funnels) are simply a sequence of action steps that your leads must go through in order to “convert” (e.g. buy one of your products).
For example, for a typical B2B company, a website visitor may first discover a couple of blog posts by the company, then click on a product page link, fill out a contact form, schedule a call with a sales representative, and then become a customer.
On Google Analytics, each step of a goal funnel represents a step on your website that must be completed to achieve a Google Analytics Goal. Each step must be a web page with its own URL.
This week, we’ll teach you how to properly set up conversion funnels and distill actionable business insights from your funnel visualization report. We’ll cover:
Limitations of Google Analytics Goal Funnels
Why Goal Funnels?
Setting Up Goal Funnels on Google Analytics
Using Your Funnel Visualization Report for Analysis and Insights
Limitations of Google Analytics Goal Funnels
It is worth noting that this is one of the limits of goal funnels on Google Analytics. You can only track page-to-page funnels (where each step is a web page). As of now, although Google Analytics does offer some event tracking, “event funnels” are not currently supported (you need to use tools like Heap Analytics or Mixpanel for that).
A second limitation is that events and pageviews are only tracked on Google Analytics after they have been set up — it cannot track data retroactively like Heap Analytics can (which tracks all the data just in case).
Lastly, goal funnels are not as useful for tracking multi-session engagement. For example, it is not very good at tracking how website engagement turns into conversion (e.g. Homepage >> Product Page >> Checkout) because your users may complete this action in multiple sessions. Funnels are only reliable in tracking drop-offs and completions in one session.
These three factors (no event funnels, no retroactive tracking, no multi-session tracking) are all limits that you must take into account when you use goal funnels to answer your business questions.
That having been said, Google Analytics goal funnels are still a powerful feature that is really good at one thing — tracking drop-offs for conversions.
Why Goal Funnels?
Goal funnels are especially valuable for ecommerce businesses (i.e. think Shopify websites) with a particular series of steps required to make a purchase. But goal funnels aren’t just useful for ecommerce companies. All sorts of businesses can use goals and funnels to track micro conversions (actions that move leads closer to a purchase) such as submitting a contact form or visiting certain pages that indicate interest.
For example, let’s say you have an ecommerce company that sells T-shirts. The checkout funnel might look something like this:
Product Gallery — Product Page — Add to Cart — Proceed to Checkout — Shipping Information — Billing Information — Review — Confirmation Page.

One of the most compelling reasons for tracking a goal funnel using Google Analytics is the ability to quickly identify “problem pages,” i.e. exit pages where potential customers drop off or abandon their cart.

The problem may be technical (e.g. there is an error on one of the pages in the payment process) or design-related (e.g. there are too many pop-ups with promotional offers), but either way, you can’t fix these problems unless you use a tool to track how your funnels are performing.

This is where the Google Analytics Funnel Visualization report comes in. In one glance, you can see user behavior for each step of the funnel. The funnel can help you see visually how many users make it to the next step toward the conversion goal, and how many drop off. If you see a big group of users dropping off on a specific page, you should drill down to see what is driving the high exit rate for that step of the funnel.

The Funnel Visualization report on Google Analytics shows you how many users make it to the next step of purchasing a product.
To learn more about other ways to optimize the pages and user flow of your website, check out our past post: How to identify and fix the problem pages on your website with Google Analytics
Now that we understand the value of configuring goal funnels, let’s take a look at how to set one up.
Setting Up Goal Funnels on Google Analytics
Set Up the Goal
To set up a goal funnel, you must first set up a Google Analytics goal. As we explained in last week’s post, navigate to Admin >> Views >> Goals >> New Goal.
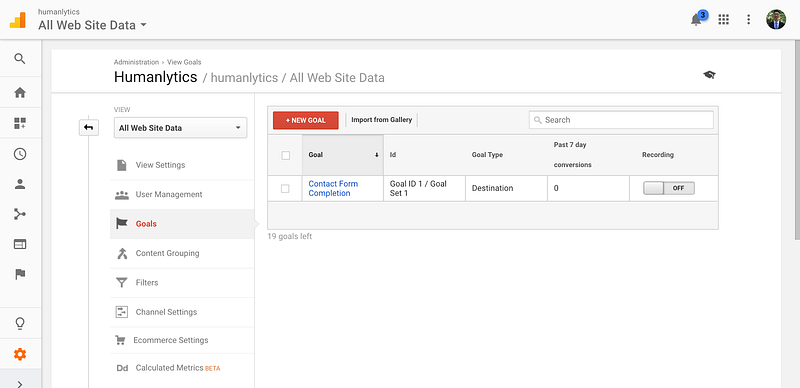
Admin >> Views >> Goals >> New Goal
Either select a pre-set goal template or create a custom goal. In this example, let’s say we’d like to track how many website visitors make it to the purchase confirmation page for our ecommerce store. We’ll select “Make a payment.”

Name the goal something you’ll remember. Since we want to measure the number of purchase confirmations, we’ll call it “Purchase Confirmation.” You can only use the Goal Funnels feature with destination goals, so we’ll select “Destination” as our goal type.

Enter the URLs of Each Step of the Funnel
Once you get to this point, toggle the Funnel switch to “On” to set up the pages of the funnel. Each step represents a web page that your website visitors must pass through to reach your Goal (e.g. in this case, completing a product purchase).
In this example, we’ll need to include a unique part of the URL for each page the user has to view in order to check out and make a purchase. We can name each step in our funnel and add the unique part of the URL.
For Shopify websites: Shopify has implemented its own Analytics code so the URL for the funnel page may be different than your actual web page URL. You can go into All Pages report (Behavior >> Site Content >> All Pages) to see what URL Shopify assigned to each of the pages.

If a potential customer must complete a certain step in the funnel to complete the goal in our funnel visualization report, toggle the “Required” switch to “Yes.” In our example, we only want to track website users who began the funnel on the first “Checkout” (/CheckoutCart) page, so we’ll make that first step required.
Note: This “Required” switch will only affect the numbers on the funnel visualization report, not the Goal completion metrics in your Conversions report.
Finally, click on “verify goals” to make sure your Goals are tracking the correct data properly.
Warning: when a goal is verified, it only means that your Goals are working; it doesn’t necessarily mean tracking on each page of the funnel is working properly. To confirm each step of your funnel is working, you need to wait about a week for enough data to be collected. Then check the funnel visualization report to do a sanity check.
Congratulations, you’ve created your first goal funnel!
Using Your Funnel Visualization Report for Analysis and Insights
As always, you can find your Goal metrics in your “Conversions” reports (Reporting >> Conversions >> Goals >> Overview).
To view your funnel visualizations, go to Conversions >> Funnel Visualization.

Reporting >> Conversions >> Funnel Visualization
As you can see in this example, there is a huge cart abandonment issue between the Cart page and the Billing/Shipping page. Only about 43% of users made it past the Cart checkout to the Billing/Shipping step.
As you can see in the screenshot, most of the users that dropped off simply exited the site. However, you don’t have to worry about exits to “/signin.html” because it is simply the page asking the user to sign in to their Google account before they checkout.

This visualization is one of the most efficient ways to understand the typical user flow of your website for most of your visitors. For instance, if users are dropping off the funnel you set up in order to get to another page on your site (e.g. a product promotion page), perhaps you should figure out why they are drawn to that page. You may even want to incorporate that page into your funnel.
To further explore how to improve the design of your web pages to enhance the on-site experience and engagement of your users, check out: How to Create Great Website Experiences Without Fancy Designs
Tip: You can find and add Google Analytics Goals configured by other businesses in the Analytics Solutions Gallery. You can then adapt and modify these for your company’s business objectives.
For example, you can download Google Analytics Goals that are common in a certain industry, such as Shopify eCommerce funnel goals:

Next Steps
Thanks for learning how to properly set up a conversion funnel on Google Analytics with us. Stay tuned next week for a step-by-step tutorial on how to segment and analyze your audience data in Google Analytics.
1. To learn how to improve your Goal metrics, check out our previous article: Conversion Optimization — 3 Simple Steps to Improve Your Conversion Rate Using Google Analytics
2. Kissmetrics also has a great guide on configuring Google Analytics conversion funnels: The Google Analytics Conversion Funnel Survival Guide
3. If you found this helpful, please subscribe to our newsletter below (and follow us on Medium) to get our weekly digital marketing digest, more tutorials, and updates on our AI-based digital marketing tool (beta in progress)!